I record a daily weight measurement, usually first thing each morning. As one would expect this can vary a lot from day to day for all sorts of reasons. To get a better handle of the trends a smoothing filter can be applied to the data. There are many methods of doing this, eg Moving Averages. The one I've opted to use here is the Leaky Integrator [3] due to its simplicity.
The unsmoothed chart looks like this.
The following is a GnuPlot chart that applies the Leaky Integrator smoothing to the data (assumed to be in file weight.dat, see part 1 on how to extract this from the wwdiary database):
# GnuPlot script to plot smoothed weight from datafile in format
# uuuuuuuuuu ww.w
# Where uuuuuuuuuu is date in unix epoch time
# and ww.w is weight (in kg here, but trivial to change to other units).
# One record per line.
#
# Smoothing is acomplished with the Leaky Integrator
# http://en.wikipedia.org/wiki/Leaky_integrator
#
# Joe Desbonnet, jdesbonnet@gmail.com, June 2014.
#
set xdata time
set timefmt "%s"
set format x "%m/%Y"
set xtics font "Arial, 10"
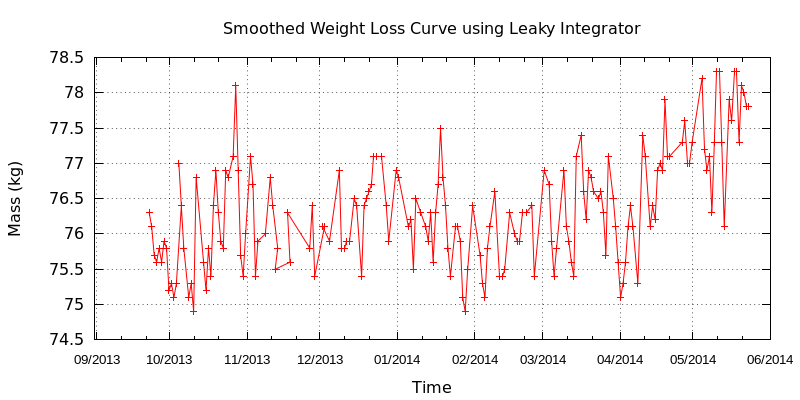
set title "Smoothed Weight Loss Curve using Leaky Integrator λ=0.8"
set xlabel "Time"
set ylabel "Mass (kg)"
set grid
set key off
set term pngcairo size 800,400
set output "weight.png"
# Lambda (0 ≤ λ < 1.0) determines smoothing. Higher values for more smoothing.
lambda=0.8
ym1=0
leaky_integrator(x) = (ym1 = ym1==0 ? x : (1-lambda)*x + lambda*ym1)
plot 'weight.dat' using 1:(leaky_integrator($2)) with linespoints, \
'weight.dat' using 1:2 lt 3
After applying the smoothing filter (and plotting the original points in blue for reference):

You can adjust the 'strength' of the smoothing filter by changing the value of lambda. Lambda can vary from 0 to 1. The closer to 1 the higher the smoothing effect.
References:
[1] http://jdesbonnet.blogspot.ie/2014/06/weight-charts-from-wwdiary-part-1.html
[2] https://play.google.com/store/apps/details?id=com.canofsleep.wwdiary
[3] http://en.wikipedia.org/wiki/Leaky_integrator
1 comment:
I have a different scheme for eliminating noise from weight readings... I only ever note down the weight and date of the lowest ever reading. So in the long term this eliminates transient fluctuations from the eating cycle and has the psychological effect of only ever showing positive progress :-) Longest I ever went without any recorded drop was 8 or 9 months though; but not a problem as my weight loss target is only 15-20lbs per year over a 5 year period and in the long term I'm well on target :-)
Post a Comment